's economy performs well on resource and production-based CO² productivity. It is becoming more efficient and ranks among the leaders of its innovation peers.
Resource productivity measures the total materials an economy uses directly (domestic material consumption, DMC) relative to its GDP (GDP per DMC in euros per kilogram). It shows how efficiently resources are used in production and whether economic growth is decoupling from natural-resource use. The OECD version used here excludes energy materials, unlike the EIS indicator. performs even better when energy is included.
⤓ Download image
Production-based CO² productivity tries to measure how efficiently an economy is generating value while limiting CO² emissions. 's strong performance likely reflects its specialization in high-value goods and services, combined with its comparatively low-carbon energy mix.
⤓ Download image
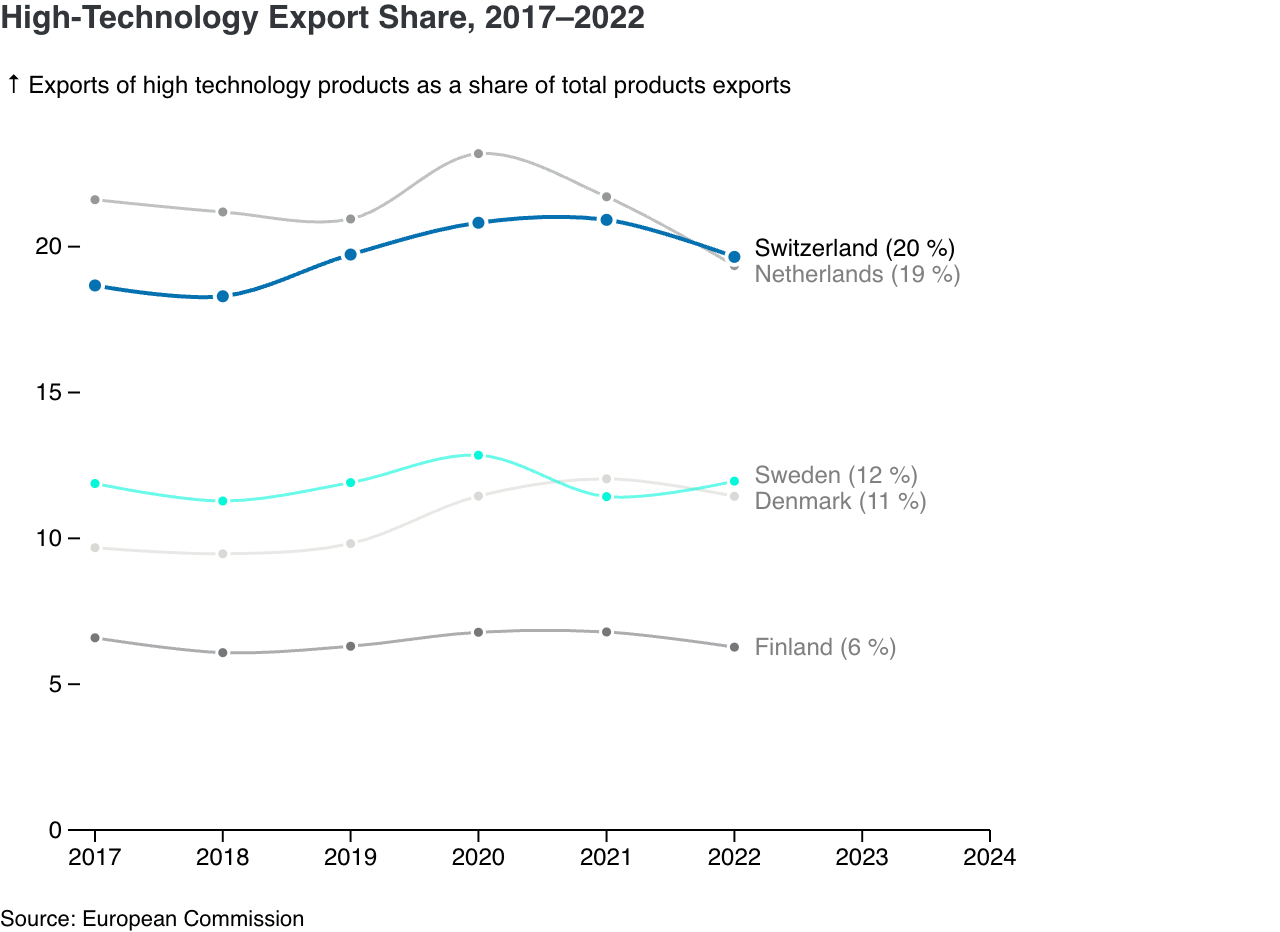
has very high share of high-tech exports. The pharmaceuticals industry is likely the most important factor for Switzerland's top position, next to the other sub-sectors included in the definition (computer, electronic and optical products as well as air, spacecraft and related machinery).
⤓ Download image
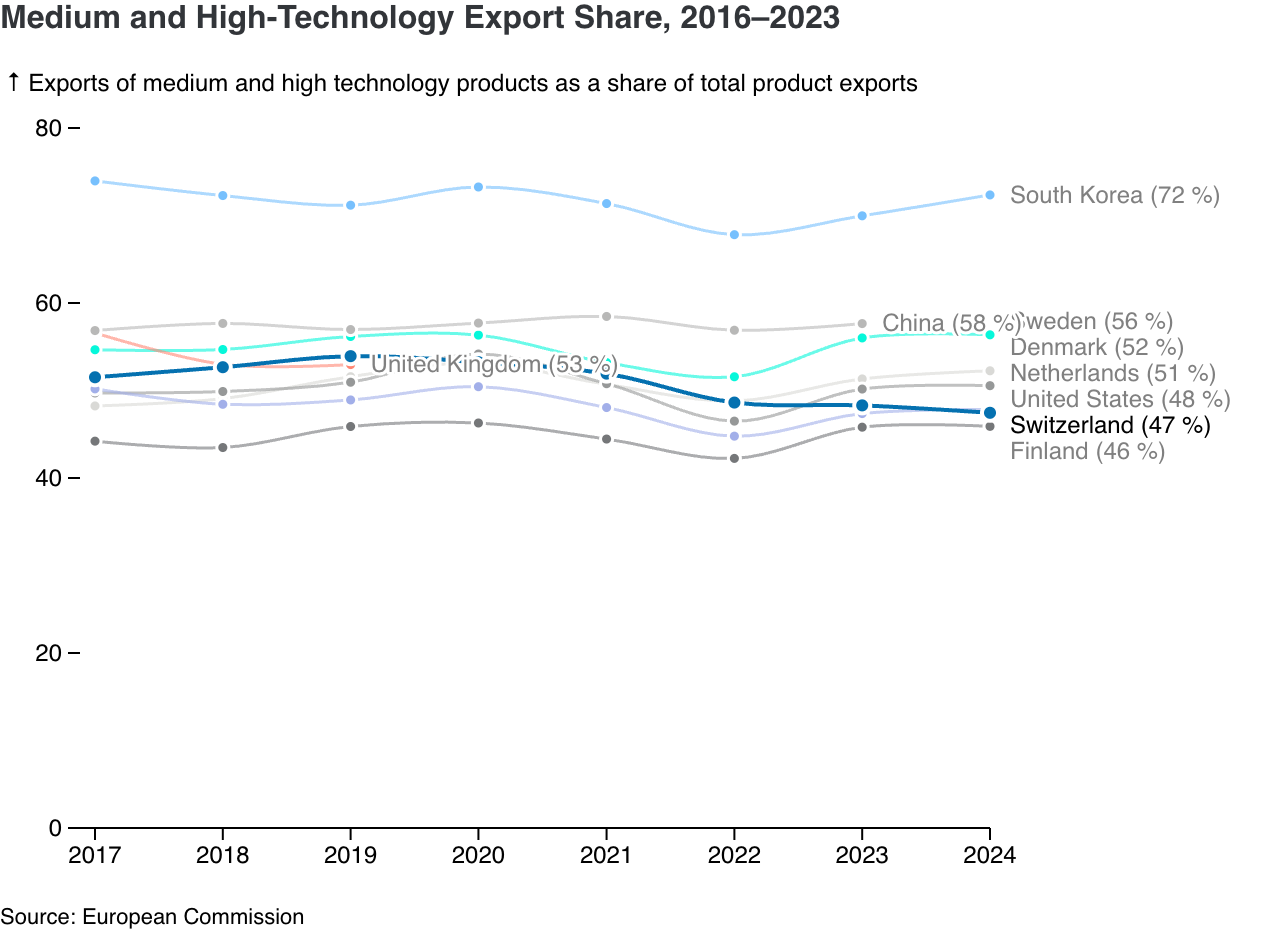
performs markedly worse than competitors like or when the scope is widened to medium and high-tech exports. This is compounded by a steady decline in its relative performance since 2019. Medium-tech exports typically include chemical products, machinery, and medical and dental instruments.
This disparity may be due to confounding factors. The current metric compares tech products against total product exports; a high volume of non-tech exports could distort Switzerland’s relative value. We were not able to definitly conclude, whether high-value commodities, such as gold exports, are included in the denominator, which would significantly skew the results.
⤓ Download image
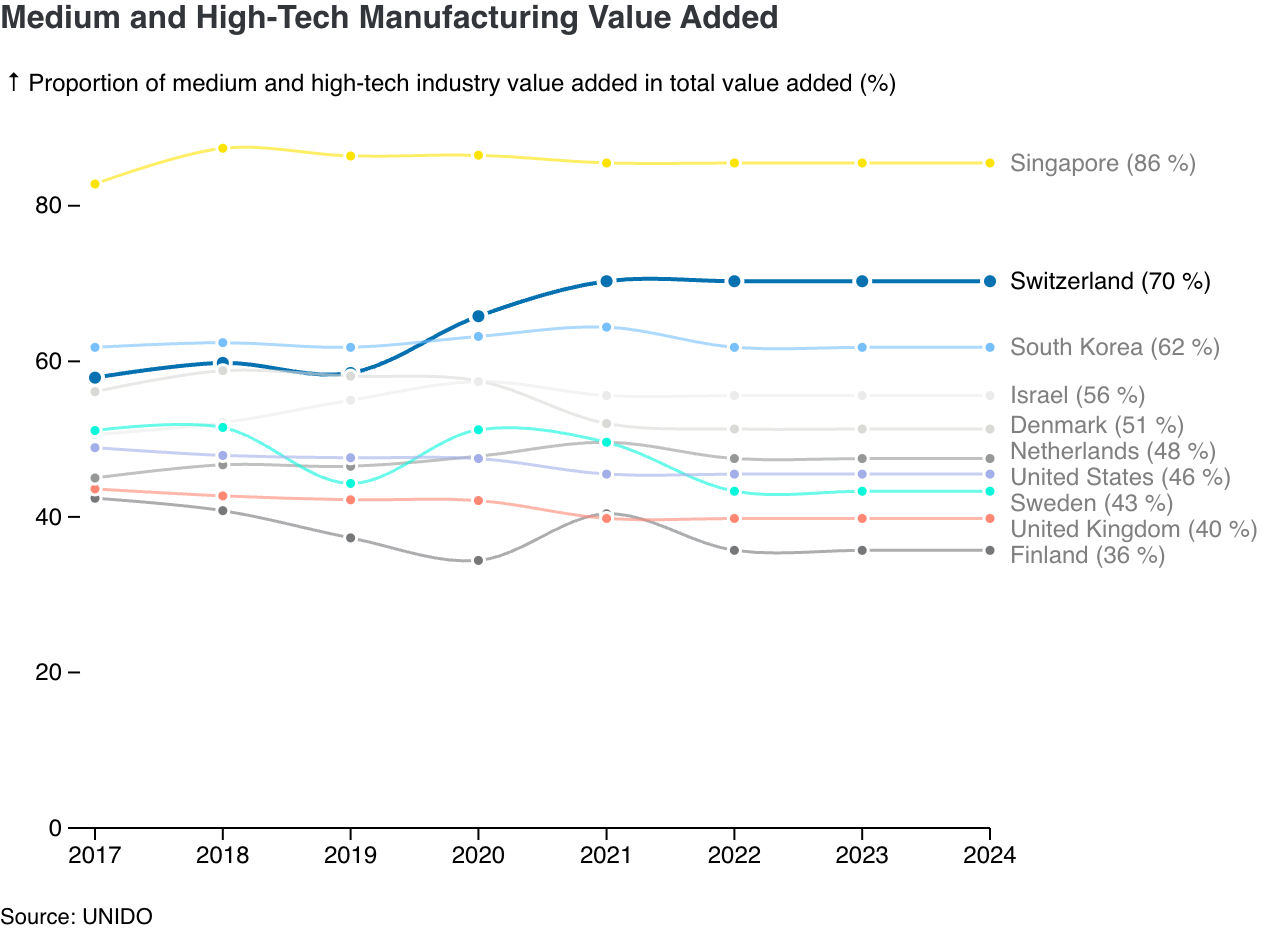
Another indication that the results are indeed skewed is that the share of medium- and high-tech manufacturing value added is comparatively high. has an 8 percentage point higher proportion of medium- and high-tech manufacturing value added than , which leads in terms of export share shown above.
⤓ Download image
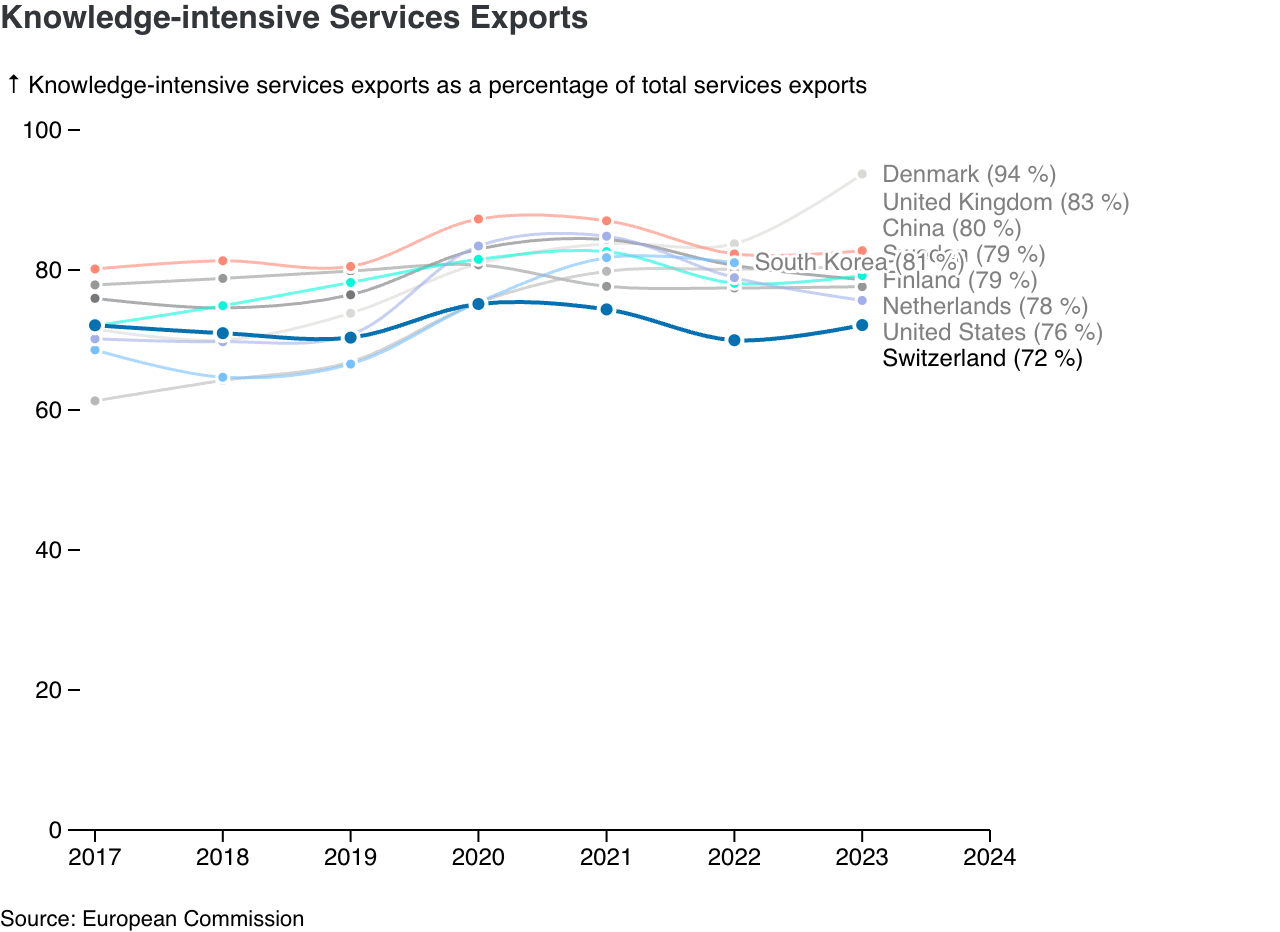
Similarly, it is notable that 's share of knowledge-intensive services (KIS), as a percentage of total service exports, has become comparatively low. The KIS definition includes predictable areas—such as insurance, financial services, intellectual property charges, and IT—but also less obvious ones, including sea, air, and space transport. Remarkably, the United States, despite its domineering tech and software sector, sits at the lower end of this same spectrum.
⤓ Download image
- OECD (2025) Green Growth Database
- European Commission (2024) European Innovation Scoreboard