Entrepreneurship and Start-ups
Venture capital market in Switzerland
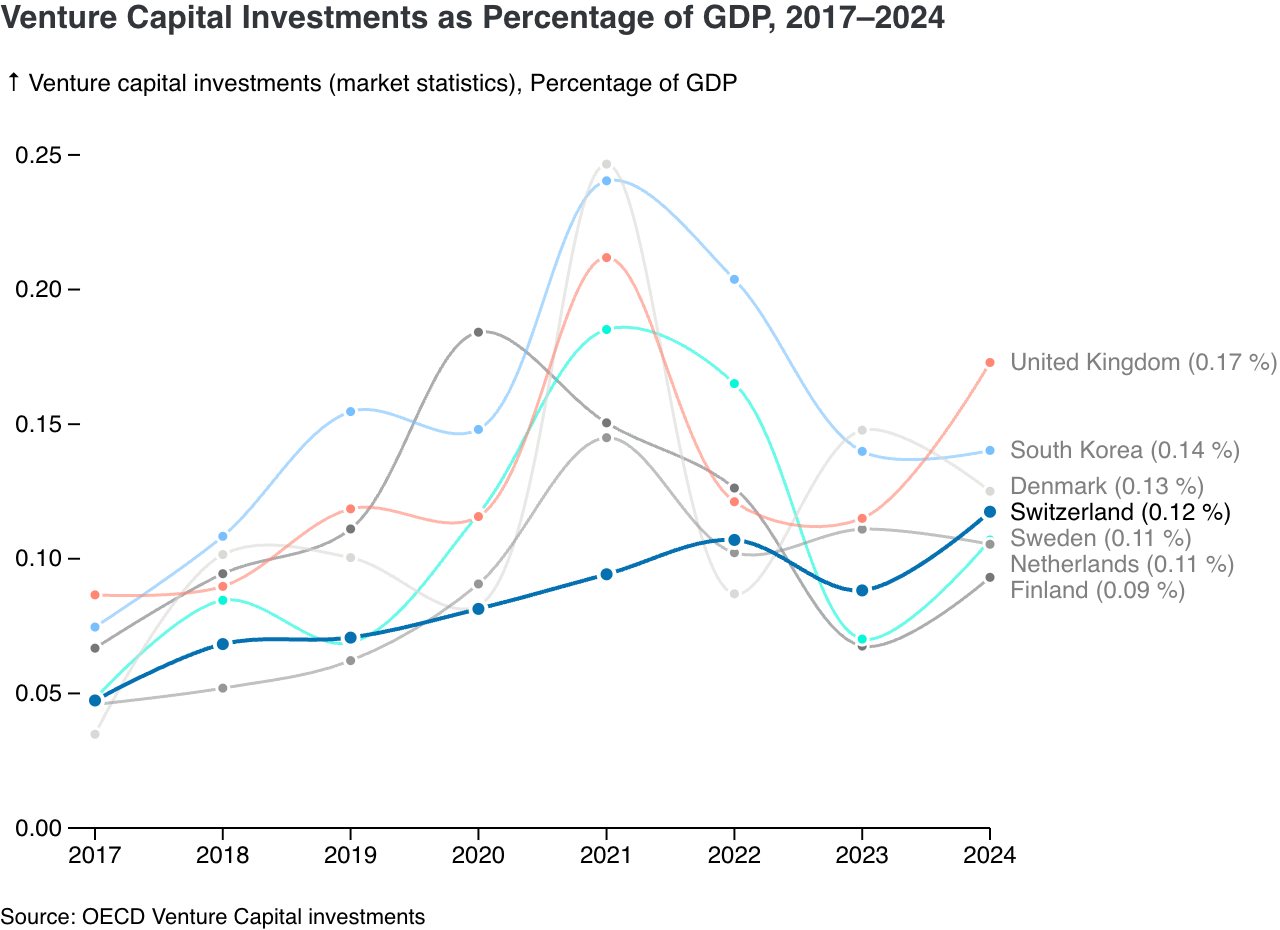
Venture capital availability in
Venture capital investments in % of GDP 2017–2024
According to the report «Fast-growing start-ups in Switzerland» (SECO, 2017) the venture capital market in
Total early-stage entrepreneurial activity (TEA)
The share of 18-64 population who are either a nascent entrepreneur or owner-manager of a new business in
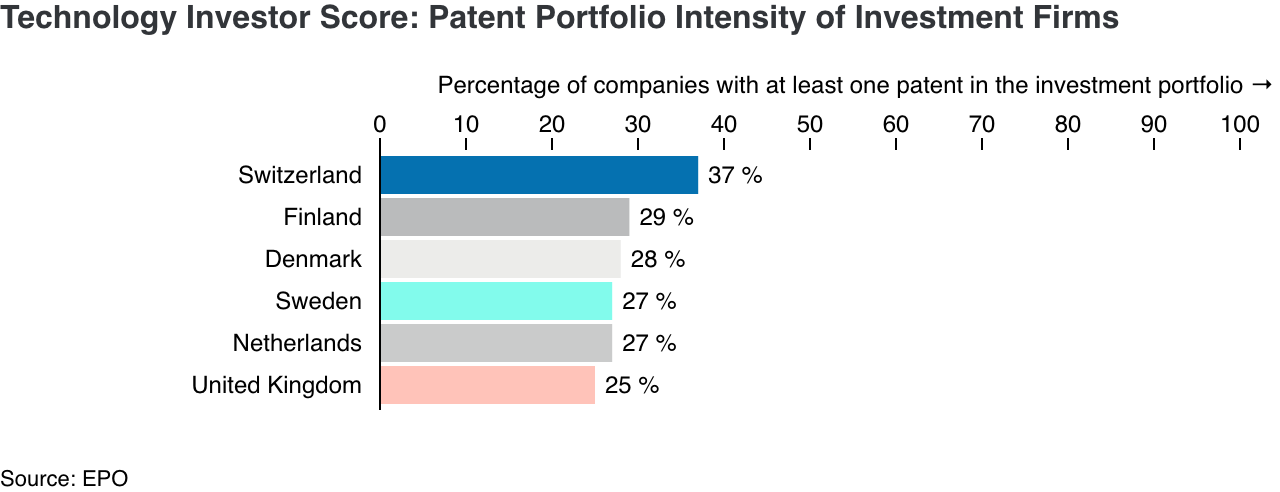
Technology Intensity of Investment Portfolios
The European Patent Office (EPO) links its own patent data to dealroom.co's data on investors and their investments and creates a comparative analysis of the technology intensity of the investment portfolios in Europe and the US.
The EPO introduces the metric Technology Investor Score (TIS) designed to identify investors specialized in supporting high-tech companies. The TIS measures the percentage of companies with at least one patent within an investor’s portfolio. A high TIS indicates an investor’s engagement with innovation-driven companies.
The analysis reveals "significant funding gaps between Europe and the US for high-TIS private investors, particularly in critical technology sectors with high growth potential. These gaps are also most evident in the later-stage funding rounds essential for scaling up. Instead, we find a funding surplus for public investors."
In other words, the US has more funding from high-TIS investors who are private, specialize in later-stage rounds (scale-up), and invest in high-tech sectors. This is only partially offset in Europe by greater funding from public investors.
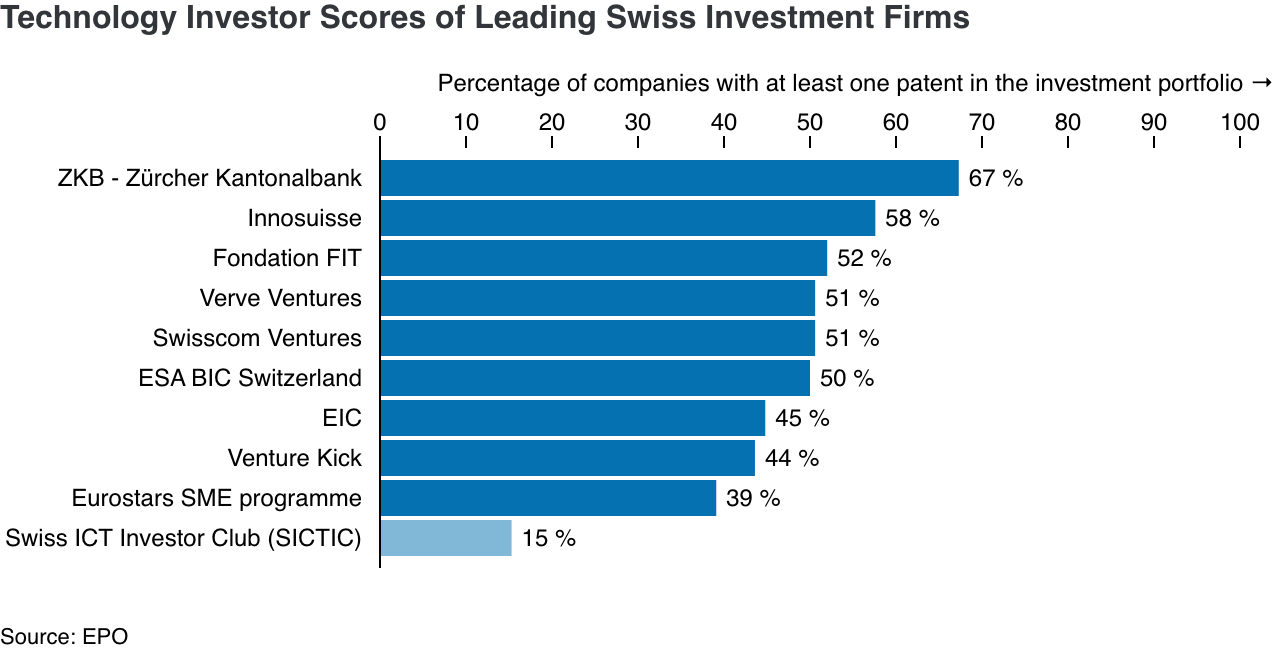
These funding gaps also apply to Switzerland. However, they are less pronounced than in other European countries because Switzerland ranks at the top in most categories compared to its European peers, including having a more mature VC market and investors with higher TIS scores. Innosuisse also appears as a public investor with a high TIS score, primarily because its support for the Swiss Accelerator and Start-up Innovation Projects is included in the dealroom.co data.
Average Technology Investor Score (TIS) by country
TIS-Score of top Swiss investors
Unicorn companies
This report uses CB Insights' unicorn database as the main data source, as it offers the best, freely available basis for comparing unicorns across countries. Since there's no official data on unicorns and different sources define them differently, we compared the data to the results of Dealroom, PitchBook, and Crunchbase. While the exact numbers vary, the relative differences between countries are similar.
Number of unicorn companies relative to GDP
The graph below compares countries' efficiency in creating unicorn companies relative to their economic size, measured as the number of unicorns per $133 billion of GDP. Switzerland produces one unicorn per $133 billion GDP, similar to the Netherlands and Sweden. In contrast, the United States and Israel significantly outperform this benchmark, generating 3-6 times more unicorns relative to their GDP. CB Insights defines a unicorn company, or unicorn startup, as a private company with a valuation over $1 billion.
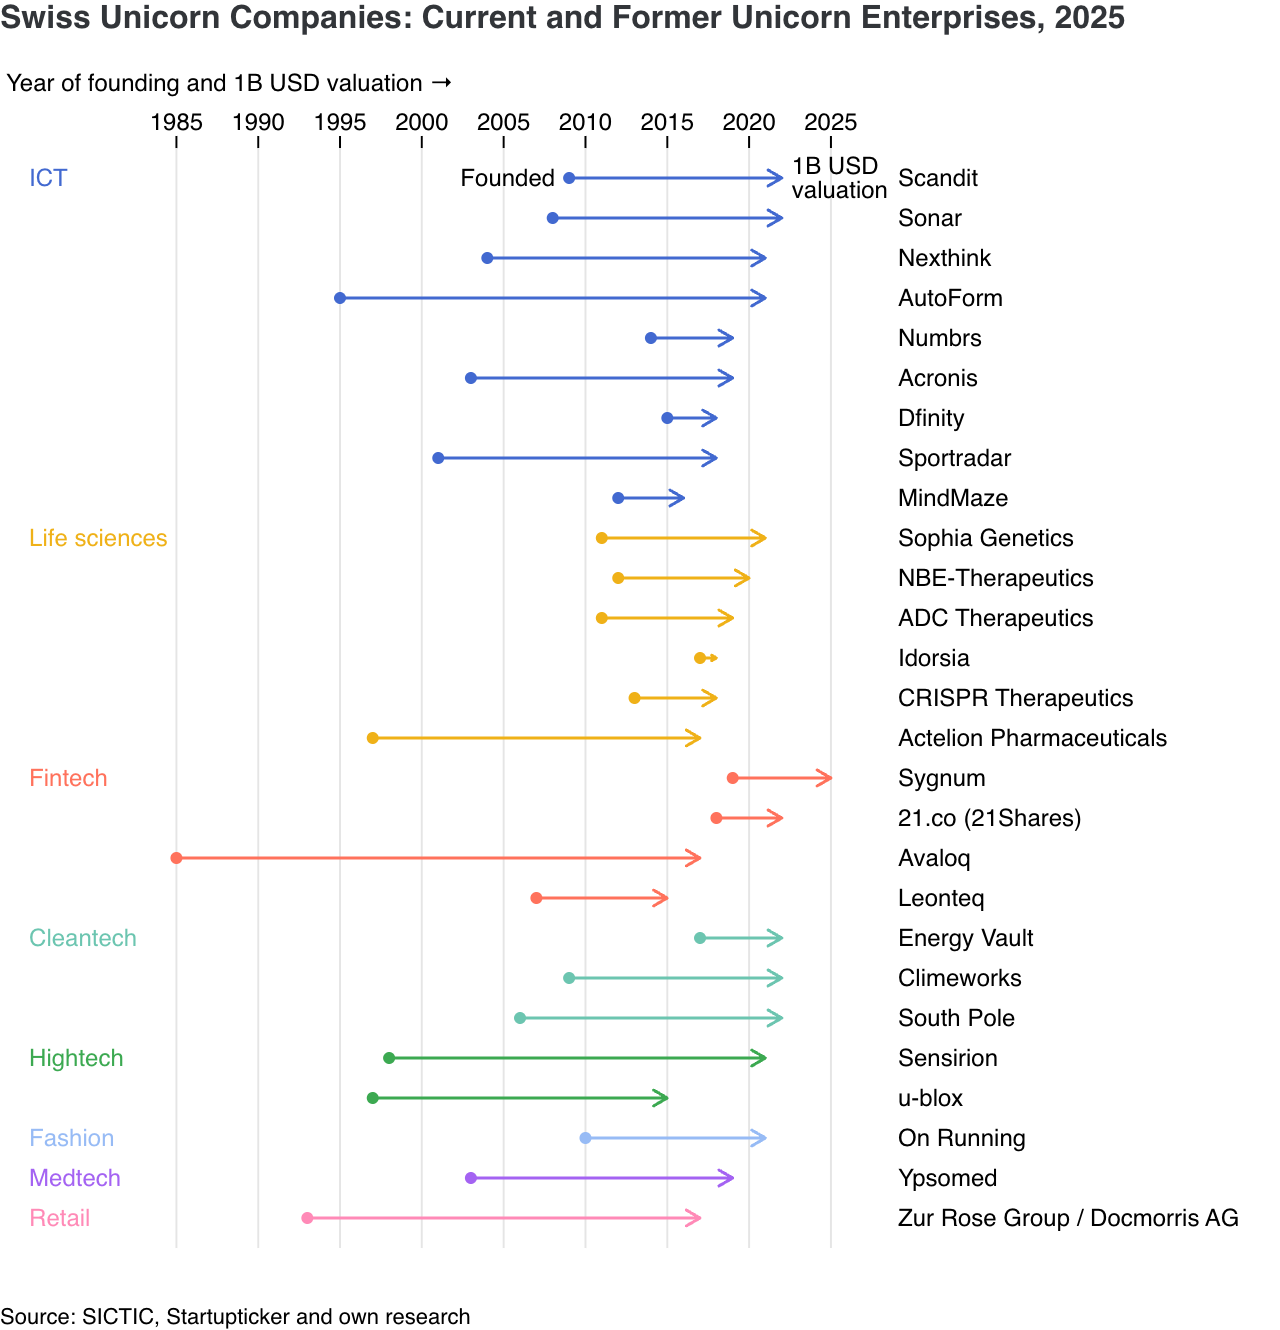
Swiss unicorn companies
We've also created our own list of Swiss unicorns, including both current unicorns and former ones that have gone public or been acquired, thus some might not meet the strictest unicorn definition. Accordingly, the number is significantly higher than the number in the CB Insights data (28 vs 6). The list is based on the list of the Swiss ICT Investor Club (SICTIC) and has been updated with our own research.